
Odyssey provides you with the powerful tools needed to run reports over multiple datasets at once. Let's dig in!
To run a report:
- Select 'Printshop'
- Select 'My Reports'
- Select the
 button to create a new report
 - Select a dataset that you would like to be included in this report under 'Dataset 1'
- Select a 2nd dataset you would like combined with Dataset 1 under 'Dataset 2'
- Including a 2nd dataset is optional
- Deselect the columns not needed to be viewed under the 'Columns and filters by column' section for both Dataset 1 and Dataset 2
- Select a 'Group by' column under 'Grouping and functions'
- The report data will be placed in groups based on this selection
- Select a 'Column for aggregate function' column under 'Grouping and functions'
- The report data will be grouped by this column within each group from the 'Group by' selection
- Select a 'Aggregate function' selection under 'Grouping and functions'
- This tells the report to show the total number (SUM), the number of line items (COUNT), the MIN, MAX, or the AVG of the option chosen from 'Column for aggregate function'
- Select a Date under 'Date Range'
- Select a 'Start Date' and 'End Date' under 'Date Range'
- Select 'Next Step' to run the report
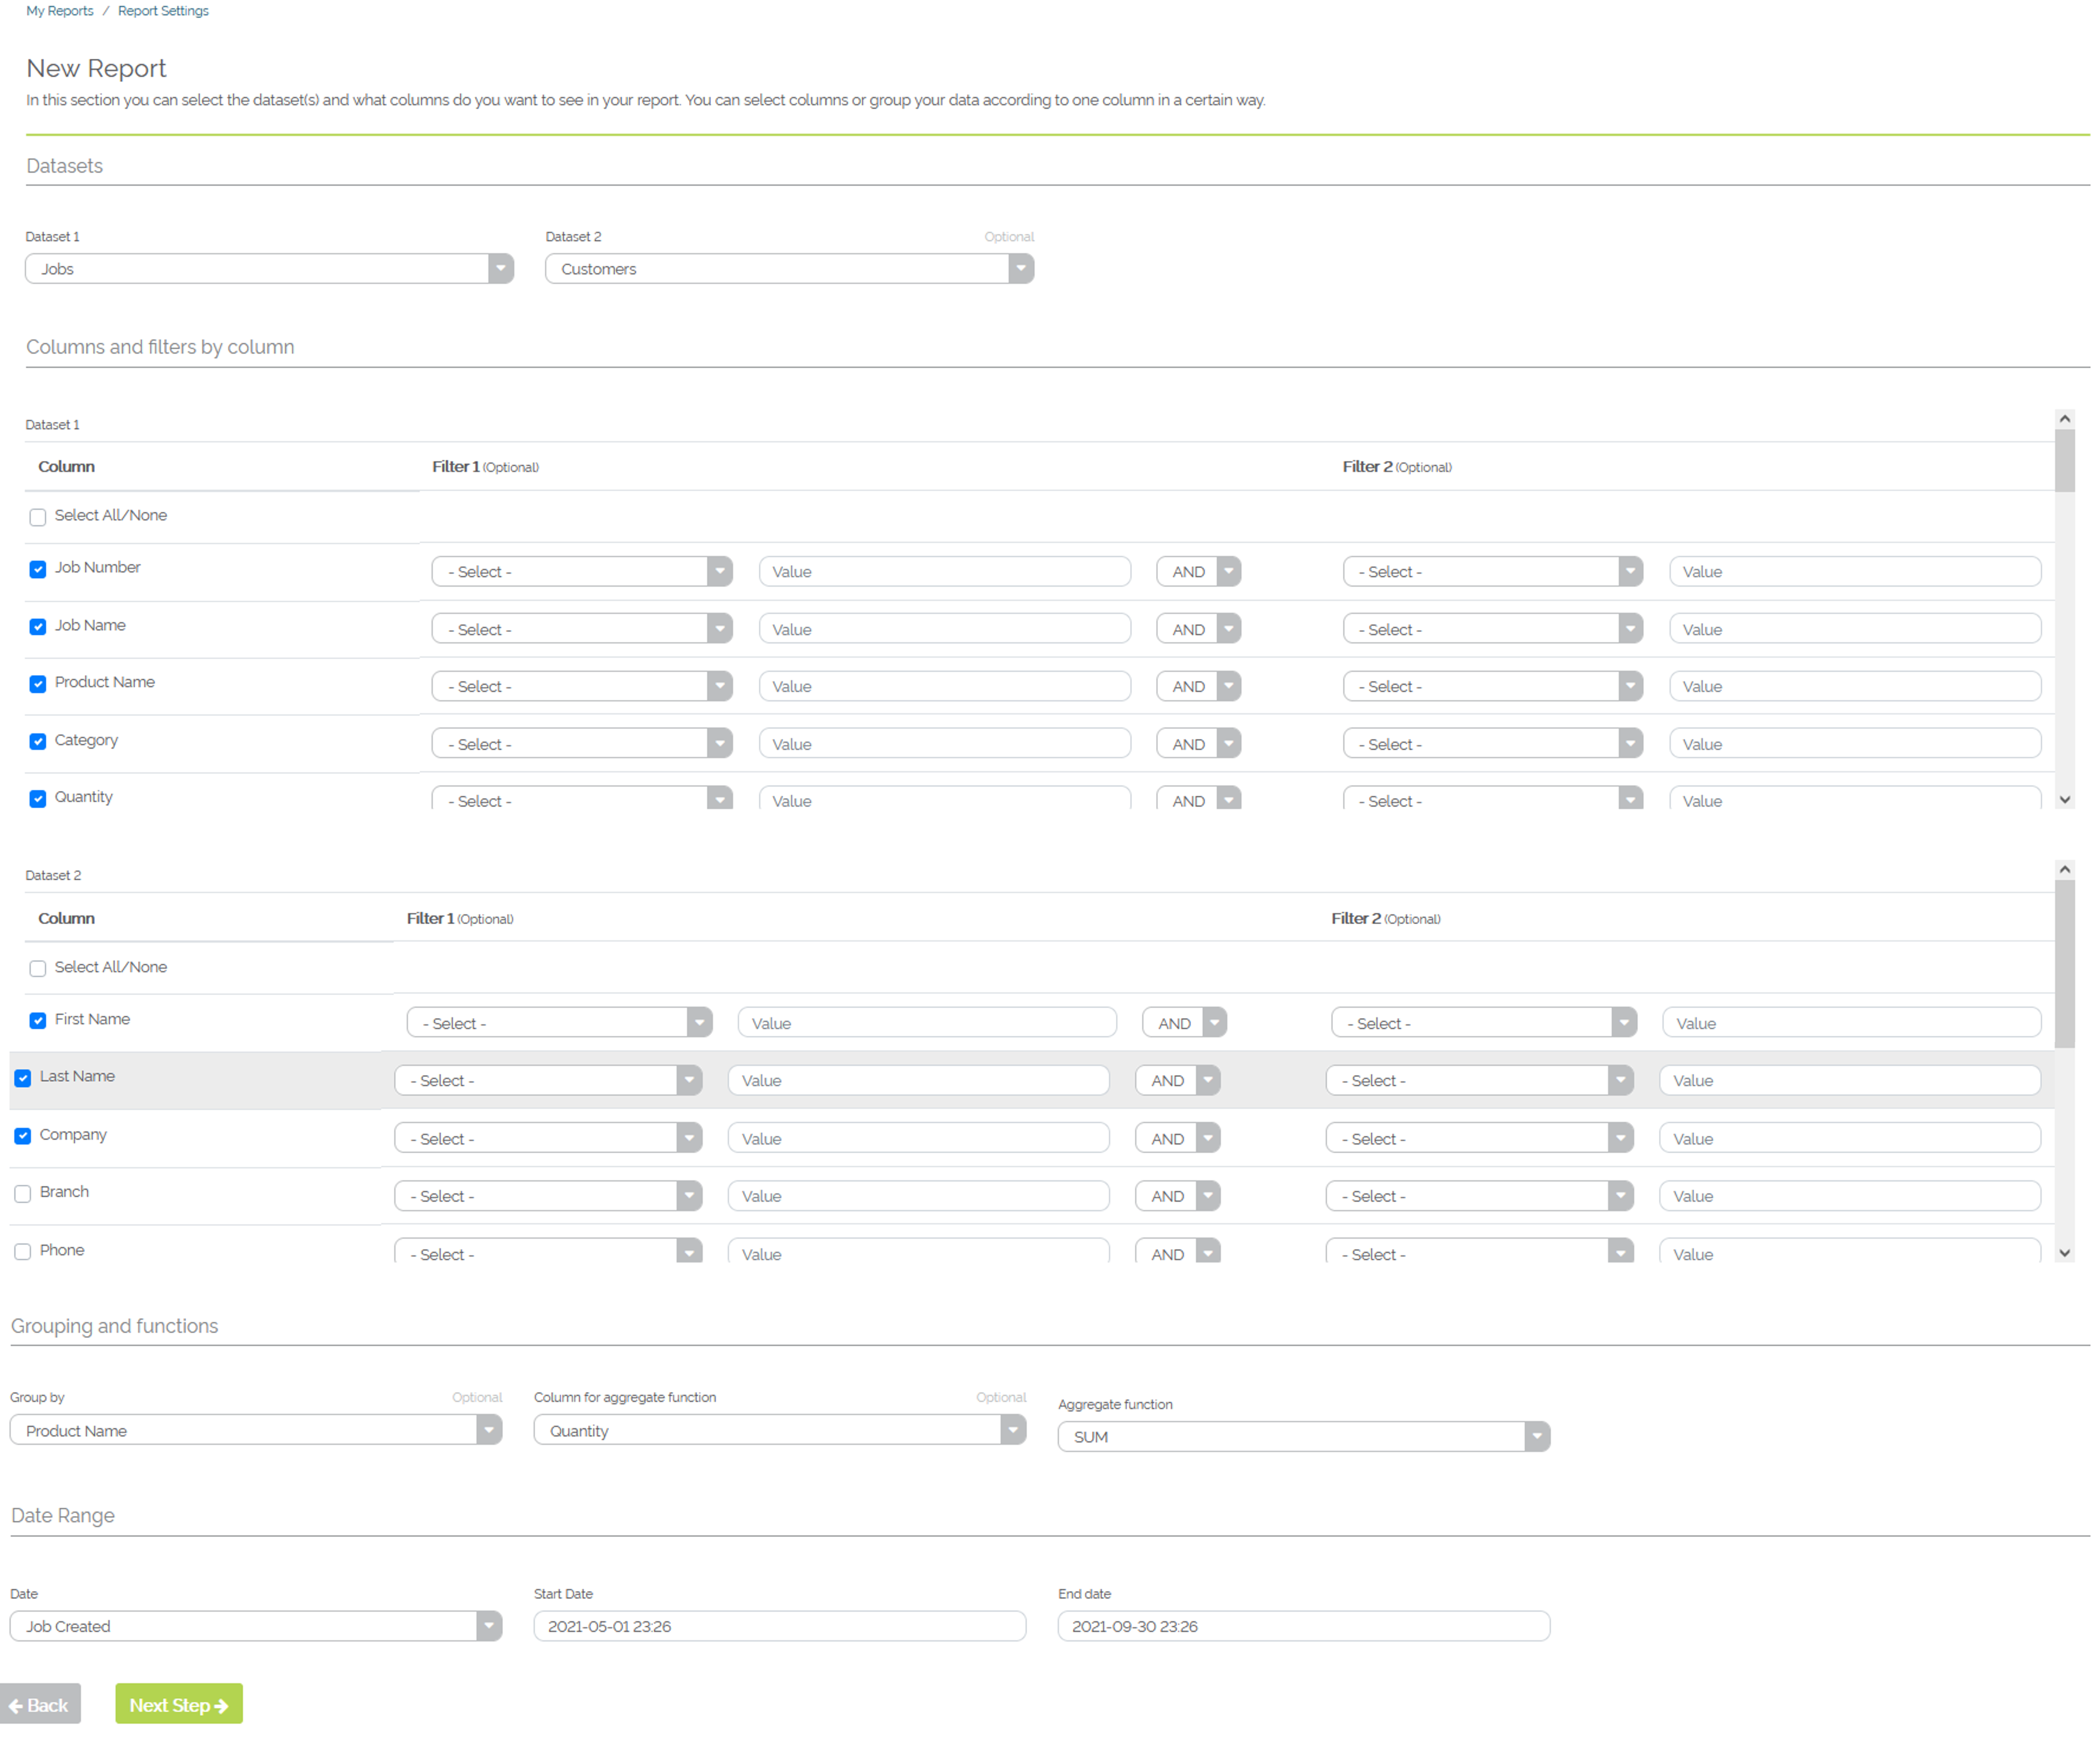
Example of a report bringing in Jobs & Customers as the two datasets
You will be taken to the next screen, which is the output of the previous screen's selections.
- Select 'Download Report (pdf)' to download a PDF of the report
- Select 'Download Report (csv)' to download a csv file of the report
- Select a page number if your report has more than one page below the 'Data' line
- Add a name for this report under 'Filter Name'
- Select 'Save' to save this report under as part of 'My Reports'
Let's break down the output of the below output report:
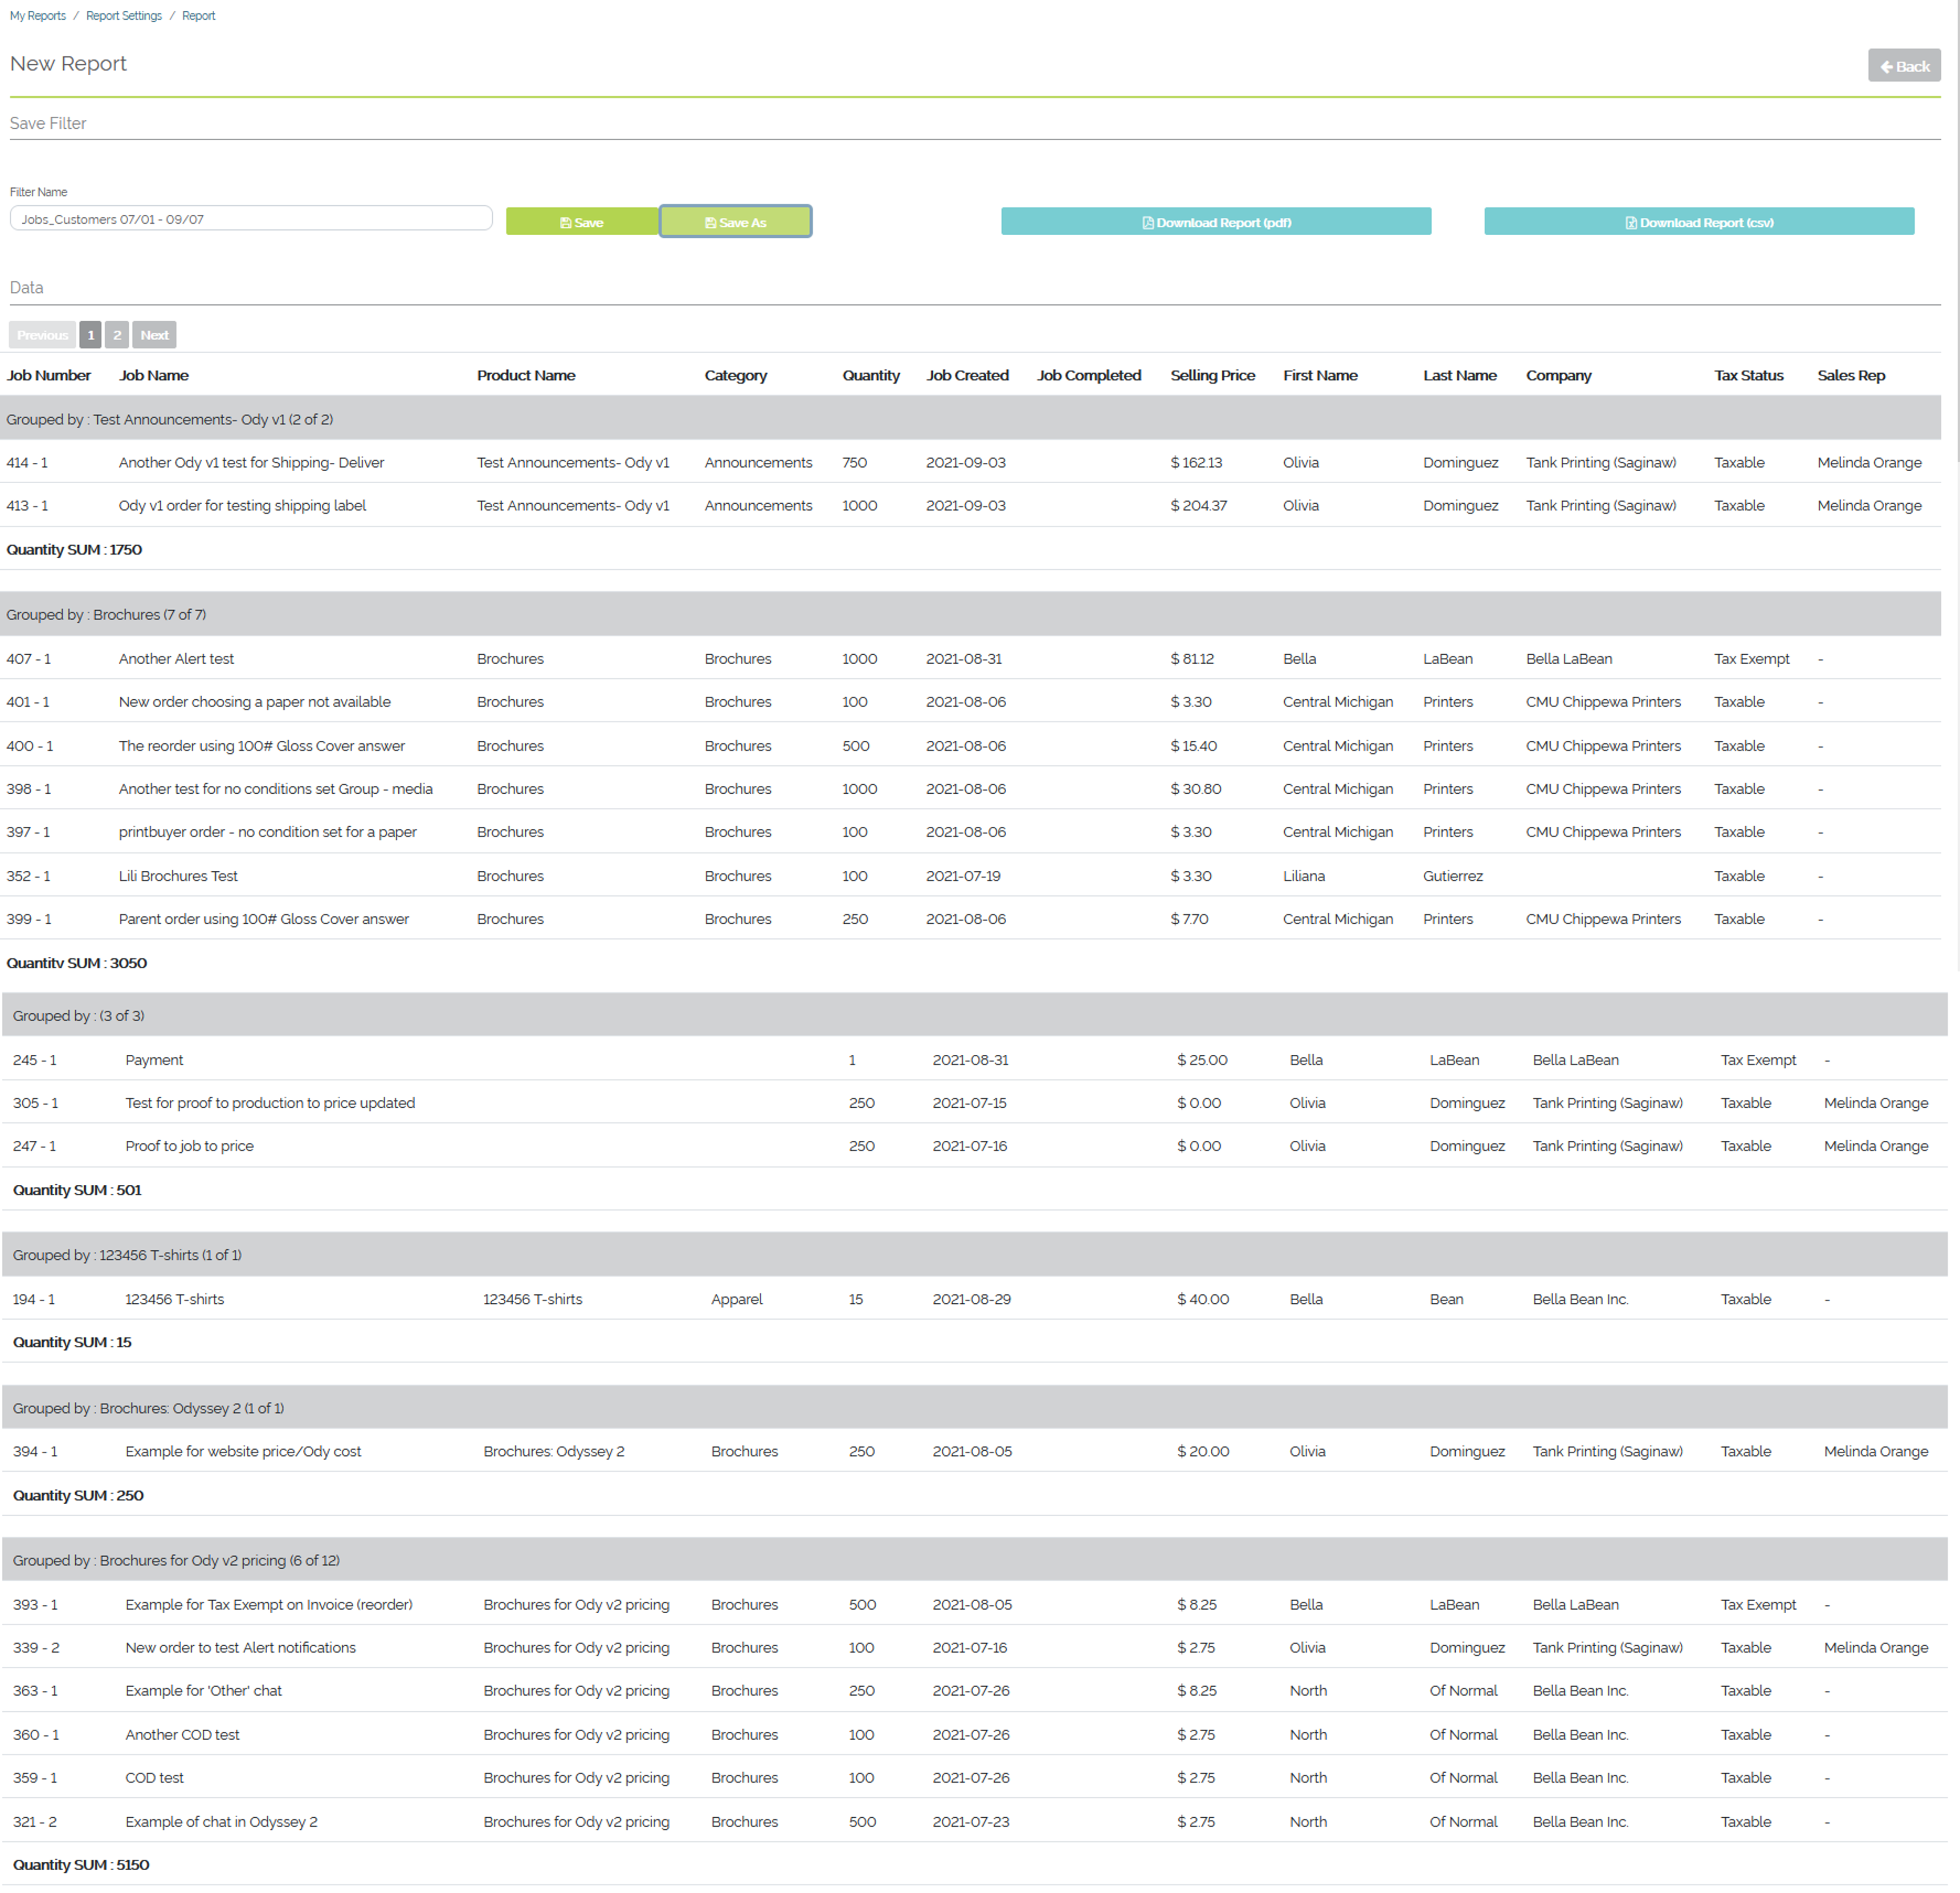
Example report output of Jobs and Customer datasets combined
- The report is grouped by Product Categories. This is based on the selection of 'Product Name' under 'Group by'
- Within each group of Product Categories, the 'Column for aggregate function' that is being used us the Quantity column.
- This is based on the 'Quantity SUM' line that shows up after the last line item of each product category grouping
- To further break down this example report:
- Two orders are within the 'Test Announcements' category
- The total quantity ordered from this category within the 'Start Date' and 'End Date' selected is 1750
- Seven orders are within the 'Brochures' category
- The total quantity ordered from this category within the 'Start Date' and 'End Date' selected is 3050
- And so on...
- Two orders are within the 'Test Announcements' category
To access user-saved reports:
- Select 'Printshop'
- Select 'My Reports'
- Select 'My Reports'
- Select the saved report under 'Report Name'
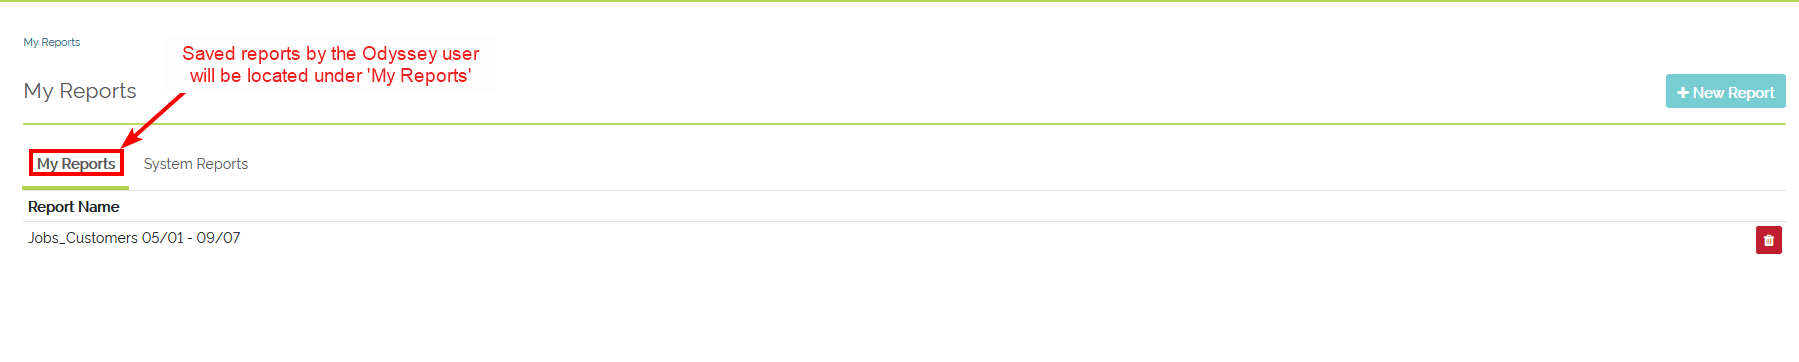
Saved reports under 'My Reports'
To delete a report:
- Select 'Printshop'
- Select 'My Reports'
- Select 'My Reports'
- Select the red trashcan to the right of a saved report
To access MI4P-saved System Reports:
- Select 'Printshop'
- Select 'System Reports'
- MI4P-provided reports will be located in this section
Refer to the below video for report basics.